What happens when long term assets are Marked-to-Market (“MTM”) during a period of rising interest rates and monetary tightening? Answer: Banks on average lose 10% or $2 trillion of assets off their balance sheet.
What effect does a bank’s reliance on uninsured deposits (uninsured deposit ratio using reported and MTM assets) have on the possibility of a run on and subsequent failure of a bank? Stated otherwise, if assets are all MTM, then does the bank have sufficient assets to cover all uninsured deposits and presumably stave off a potential uninsured depositor run? Answer: Unrecognized MTM losses and uninsured leverage provide incentives for an SVB-type uninsured depositor run.
What effect does MTM assets and banks’ reliance on uninsured deposits have on insured depositors? Answer: “Even if only half of uninsured depositors decide to withdraw, almost 190 banks are at a potential risk of impairment to even insured depositors, with potentially $300 billion of insured deposits at risk. If uninsured deposit withdrawals cause even small fire sales, substantially more banks are at risk.” See Conclusion, pages 8-9.
The goal of the project is to provide easy access to individual bank’s uninsured deposit to asset ratio (“UDAR”) and insured debt coverage ratio (“IDCR”) without the MTM adjustment to assets (as discussed more fully below).
If you are interested in the methodology and R code used to create the reports, read on below. Otherwise, you can access all of the quarterly reports.
Short Summary of How Banks Operate and How Bank Runs Happen
In banking, short-term liabilities finance long-term assets.
Banks collect deposits from customers and make personal and commercial loans and buy assets like real estate securities (mortgage-backed securities etc.) and U.S. Treasuries. Like other investors and debt issuers, when rates increase these long term assets lose face value.
Rate increases and a loss of face value on long-term assets is not supposed to be cause for concern as bank’s match asset and liabilities based on the forecasted duration of each. When an asset-liability mismatch occurs, banks could be forced to liquidate long assets prematurely or raise capital. Rising interest rates add fuel to this fire. As the authors note, banks generally fail for two broad but interrelated reasons in a rising interest rate environment:
Insolvency: Bank liabilities exceed the value of it’s assets. Banks don’t have sufficient sources of capital or accessible equity to cover liabilities (deposits) and the bank fails.
Panic: Uninsured depositors and investors become concerned about potential losses and withdraw their funds, causing a panic and subsequent run on the bank.
An Brief Overview of Mark-to-Market Accounting (“MTM”)
What the authors of the paper adeptly point out is banks’ reliance on cost basis rather than mark-to-market (“MTM”) accounting for the majority of their long term assets that could likely cause the type of asset-liability mismatch and panic causing a “fire sale” over the short-term.
Mark-to-Market accounting - also called Market Value Accounting or “MVA, also known as fair value accounting or marking to market, requires that an asset or liability be valued according to its market price, that is, the current price at which it could be sold.” Link.
However, banks are allowed to report the “hold to maturity” book value or face value of long term assets. “If a bank bought a bond for $100 (book value) or if a bond promises $100 in 10 years (hold to maturity value), basically, the bank may say it’s worth $100, even though the bank might only be able to sell the bond for $75 if they need to stop a run.” Link.
In other words, what a bank represents as fair value for an asset on it’s balance sheet might not be what the bank could sell it for in case of a “fire sale” moment, i.e., when rates rise and a run or a potential run is suspected. As the authors point out, more than half of bank assets do not use MTM accounting and are reported at their original or contractual value. For an average bank, 42% of assets are considered loans held to maturity and 24% of assets are real estate securities and treasuries held to maturity. This means that when rates rise, and these assets become less valuable on the market as their face value drops, this “market” value is not reflected on the bank balance sheet each quarter.
To remedy this, the authors of the paper used publicly available market data (ETFs etc) to mark 2021Q4 assets down to market value. They had two main conclusions from this exercise: (1) MTM treatment reveals banks assets are likely $2 trillion lower than reported and (2) this is “an average [decline] of 10% across all the banks, with the bottom 5th percentile experiencing a decline of 20%.” See Introduction, page 2.
Bank Data
Call Report Data
“Every national bank, state member bank, insured state nonmember bank, and savings association is required to file a consolidated Call Report normally as of the close of business on the last calendar day of each calendar quarter, i.e., the report date.” General Instructions.
Federal Financial Institutions Examination Council (FFIEC) - The FFIEC is “a formal interagency body empowered to prescribe uniform principles, standards, and report forms for the federal examination of financial institutions.” FFEIC links:
NIC Natiional Information Center - Data Download - XML and CSV data downloads for select banks and institutions for which the Federal Reserve has a supervisory, regulatory, or research interest.
The first step in the project is to manually download, save and unzip the data from the FFIEC Bulk Data Download page. The data location is referenced below in the p.data.loc variable. The data referenced on this page is from 2022Q4.
Next, extract the data for each individual quarter and read into R.
Code
# data folder location for txt files from bulk data downloadp.data.loc <-"/Users/jstoetz/Dropbox/@projects/bank-fragility/data/2022Q4"# location of data filesdf.2022Q4.file.path <-list.files(p.data.loc, full.names = T)df.2022Q4.file.path.short <-list.files(p.data.loc, full.names = F)# read in all txt files into listls.2022Q4 <-lapply(df.2022Q4.file.path, function(x)(read_delim(x, col_types =cols(IDRSSD =col_double()))))# remove the last element in the list - not data we needls.2022Q4 <- ls.2022Q4[-51]# which df have character# lapply(ls.2022Q4, function(x)(typeof(x$IDRSSD))) %>% unlist()# merge all data frames in listdf.2022Q4 <- ls.2022Q4 %>%reduce(full_join, by="IDRSSD")#write_csv(df.2022Q4)
Calculating the UDAR (Without Marking-to-Market)
The authors make the point that “[u]nlike insured depositors, uninsured depositors stand to lose a part of their deposits if the bank fails, potentially giving them incentives to run.” See Run Incentives and Uninsured Leverage: Simple Example, page 5.
However, I will not MTM all of the bank’s assets in the calculations below and they are not represented in the reports on the other sections of this site. Imputing value to non-MTM assets is a highly variable process, and it is dependent on the current market rates and the individual instruments the author’s chose as a stand-in for the value of each bank’s non-MTM assets. While the author’s reference several publicly traded instruments they used to impute the change in value of the non-MTM assets, it would be highly challenging to do the same. Thus, I will use the bank’s assets as reported in the call report. However, since the median for reducing non-realized losses is 9%, applying this number across the board gives a very rough estimate of the real value of the bank’s assets when determining uninsured deposit to asset ratio and insured deposit coverage ratio.
Uninsured deposit to asset ratio answers the question: would a bank have sufficient assets to cover ALL uninsured deposits assuming that the FDIC did not close the bank prior to the run ending and the bank did not have to liquidate assets via a fire sale?
As the author’s observed regarding the 2022Q1 data: “while the decline in asset values [using mark-to-market accounting on all assets] increased the ratio of uninsured deposits to assets, virtually all banks (barring two) have enough assets to cover their uninsured deposit obligations. In other words, if the FDIC does not step in to protect the deposit insurance fund, or if the liquidation of the assets does not cause large enough fire sales, there may be no reason for uninsured depositors to run.” See Are Assets of U.S. Banks Sufficient to Cover Uninsured Deposits?, page 6-7.
However, the calculations contained herein and in the reports will only reference uninsured deposits (for a variety of reasons). Therefore, the formula for Uninsured Deposit to Asset Ratio (“UDAR”) is:
The authors note that a lower IDCR makes it more likely that FDIC intervention would be required. In thinking through the problem, this makes sense. The assumption is that uninsured borrowers would be first to run, leaving the remaining assets to the insured depositors (who we assume would be less likely to run in the first place since they assume their deposits are insured by the FDIC). This ratio shows what percentage of assets would be left after the uninsured depositors made a run. For example, a negative value for insured deposit coverage ratio means that the remaining assets after the bank paid all uninsured depositors is insufficient to cover the insured depositors without FDIC intervention.
Referencing the Data in the Quarterly Call Reports
Call report data references are in the following areas on the call reports and are referenced accordingly in the R data.frame.
Schedule RC-E - Deposit Liabilities - Part I. Deposits in Domestic Offices
RCON5590 - Preferred deposits (uninsured deposits of states and political subdivisions in the U.S. reported in item 3 above which are secured or collateralized as required under state law) (to be completed for the December report only).
Schedule RC-O — Other Data for Deposit Insurance Assessments
RCONF236 - Total deposit liabilities before exclusions (gross) as defined in Section 3(l) of the Federal Deposit Insurance Act and FDIC regulations
RCONF237 - Total allowable exclusions, including interest accrued and unpaid on allowable exclusions (including foreign deposits).
RCON5597 - Estimated amount of uninsured deposits in domestic offices of the bank and in insured branches in Puerto Rico and U.S. territories and possessions, including related interest accrued and unpaid.
RCONF049 - Amount of deposit accounts (excluding retirement accounts) of $250,000 or less.
RCONF050 - Number of deposit accounts (excluding retirement accounts) of $250,000 or less
RCONF051 - Amount of deposit accounts (excluding retirement accounts) of more than $250,000.
RCONF052 - Number of deposit accounts (excluding retirement accounts) of more than $250,000.
RCONF045 - Amount of retirement deposit accounts of $250,000 or less
RCONF046 - Number of retirement deposit accounts of $250,000 or less
RCONF047 - Amount of retirement deposit accounts of more than $250,000
RCONF048 - Number of retirement deposit accounts of more than $250,000
Code
# Uninsured Deposit to Asset Ratio & Uninsured Deposit Coverage Ratio --------------------------------------------------df.uninsured.ratio <-tibble(Bank = df.2022Q4$`Financial Institution Name`,City = df.2022Q4$`Financial Institution City`,State = df.2022Q4$`Financial Institution State`,Zip = df.2022Q4$`Financial Institution Zip Code`,RCON5590 =as.numeric(df.2022Q4$RCON5590.x), # pref depositsRCON5597 =as.numeric(df.2022Q4$RCON5597), # est uninsured depositsRCONF236 =as.numeric(df.2022Q4$RCONF236), # total depositsRCONF237 =as.numeric(df.2022Q4$RCONF237), # total exclusions from depositsRCONF049 =as.numeric(df.2022Q4$RCONF049), # amount non-ret accts 250k or lessRCONF050 =as.numeric(df.2022Q4$RCONF050), # number non-ret accts 250k or lessRCONF051 =as.numeric(df.2022Q4$RCONF051), # amount non-ret accts 250k or moreRCONF052 =as.numeric(df.2022Q4$RCONF052), # number non-ret accts 250k or moreRCONF045 =as.numeric(df.2022Q4$RCONF045), # amount ret accts 250k or lessRCONF046 =as.numeric(df.2022Q4$RCONF046), # number ret accts 250k or lessRCONF047 =as.numeric(df.2022Q4$RCONF047), # amount ret accts 250k or moreRCONF048 =as.numeric(df.2022Q4$RCONF048) # number ret accts 250k or more ) %>%mutate_at(c('RCON5590', 'RCON5597'), ~replace_na(.,0)) df.uninsured.ratio.2<- df.uninsured.ratio %>%mutate(total = RCONF051 + RCONF047, #total amt uninsured deposits regular + retirementnumb = RCONF052 + RCONF048, #total number accounts uninsured deposits regular + retirementless250 = numb *-250, #total number times -250kTotal_Uninsured_Deposits = total + less250, #total uninsured minus 250k limitTotal_Insured_Deposits = RCONF236 - Total_Uninsured_Deposits, #total deposits minus total uninsured depositsTotal_Assets =as.numeric(df.2022Q4$RCON2170.x), #bank total assetsUninsured_Deposit_to_Asset_Ratio = Total_Uninsured_Deposits/Total_Assets *100, #UDARInsured_Deposit_Cov_Ratio =ifelse(Total_Insured_Deposits >0, (Total_Assets - Total_Uninsured_Deposits - Total_Insured_Deposits)/Total_Insured_Deposits, 0) #IDCR ) %>%drop_na()
Calculating Uninsured Deposit Amounts
Interestingly, only banks with greater than $1 billion of assets are required to separately report uninsured deposits on RCON5597. See General Instructions for FFIEC 031 and 041, page 6 and page RC-O-15 and Form FFIEC 031, page 55. As noted in the instructions for Form 031 and Form 041: “The bank’s estimate of its uninsured deposits should be reported in accordance with the following criteria. In this regard, it is recognized that a bank may have multiple automated information systems for different types of deposits and that the capabilities of a bank’s information systems to provide an estimate of its uninsured deposits will differ from bank to bank at any point in time and, within an individual institution, may improve over time.” See General Instructions for FFIEC 031 and 041, page 6 and page RC-O-15 and RC-O-16.
As of 2022Q4, there are 4633 total banks reporting of which 912 or 19.68% have greater than $1 billion in assets.
For the remainder of the banks that have less than $1 billion in assetsdo not separately report uninsured deposits, the uninsured deposits are calculated as follows:
add together the total amount of deposit accounts greater than 250k - RCONF051 (deposit amounts > 250k) + RCONF047 (retirement deposit amounts > 250k)
add together the total number of deposit accounts greater than 250k - RCONF052 (deposit number > 250k) + RCONF048 (retirement deposit number > 250k)
multiply the total number of accounts greater than 250k found in step 2 times 250,000 to return an amount that is considered FDIC insured
subtract the amount in step 3 from step 1 giving you the excess amount that would be uninsured
Visualizing the Data
Below is a brief overview and visualization of all bank data for 2022Q4.
Bank Size and Relationship to UDAR and IDCR
Since UDAR measures the uninsured deposits as a percentage of total assets, as a rule of thumb
A lower UDAR is relatively safer and means fewer uninsured deposits as a percentage of total assets,
A higher UDAR means uninsured deposits take up a larger fraction of a bank’s total assets
IDCR or Insured Deposit Coverage Ratio measures what remains after a potential run by uninsured depositors. So, as a general rule
A lower IDCR means that LESS is left for insured depositors
A higher IDCR is relatively safer and shows that insured depositors (and the bank itself) would be less likely to require FDIC involvement after a potentil run
In theory, a bank with a lower UDAR and a higher IDCR is safer when compared with a bank with a high UDAR and low IDCR.
Below is table of all banks divided by percentile “bins” based on total assets. Grouping by these asset groups, the mean UDAR and IDCR are returned. For example, the 10th percentile of banks in 2022Q4 have average total assets of $45 million with a mean UDAR of 13 and IDCR of 3.85.
As total assets increase, so does the UDAR indicating that uninsured deposits make up a larger portion of a banks balance sheet the larger its assets grow.
The mean IDCR does not appear to have a consistent relationship with bank asset size, although banks with less than $373 million of assets tend to have a higher IDCR than those with more assets.
Below is a plot of the UDAR histogram with the 5th, 50th and 95th percentile of UDAR marked. Recall that UDAR measures the percentage of uninsured deposits per dollar of assets, and that a higher UDAR is relatively less preferred than a lower UDAR.
Below is a histogram of the IDCR. A higher IDCR indicates that (hypothetically) insured depositors would be left with more funds when compared with a bank with a lower IDCR.
Measuring Liquidity Mismatch in the Banking Sector - Link
Relationship Banking, Fragility, and the Asset-Liability Matching Problem - Link
Source Code
---title: "Bank Fragility: Identifying Banks by Uninsured and Insured Deposits"date: last-modifiedauthor: Jake Stoetznerformat: html: code-fold: true code-tools: true df-print: kable---```{r}#| label: load packages#| echo: true#| include: falselibrary(tidyverse)library(XBRL)library(xml2)library(data.table)library(htmlwidgets)library(plotly)library(formattable)library(kableExtra)```## IntroductionThis project was inspired by the paper [Monetary Tightening and U.S. Bank Fragility in 2023: Mark-to-Market Losses and Uninsured Depositor Runs?](https://papers.ssrn.com/sol3/papers.cfm?abstract_id=4387676) and the recent [failure of Silicon Valley Bank](https://en.wikipedia.org/wiki/Collapse_of_Silicon_Valley_Bank). In the paper, the authors examine data from 2022Q1 Call Reports from over 4,800 financial institutions and make three primary points worth a closer look at:1. What happens when long term assets are Marked-to-Market ("MTM") during a period of rising interest rates and monetary tightening? **Answer: Banks on average lose 10% or \$2 trillion of assets off their balance sheet.**2. What effect does a bank's reliance on uninsured deposits (uninsured deposit ratio using reported and MTM assets) have on the possibility of a run on and subsequent failure of a bank? Stated otherwise, if assets are all MTM, then does the bank have sufficient assets to cover all uninsured deposits and presumably stave off a potential uninsured depositor run? **Answer: Unrecognized MTM losses and uninsured leverage provide incentives for an SVB-type uninsured depositor run.**3. What effect does MTM assets and banks' reliance on uninsured deposits have on insured depositors? **Answer: "Even if only half of uninsured depositors decide to withdraw, almost 190 banks are at a potential risk of impairment to even insured depositors, with potentially \$300 billion of insured deposits at risk. If uninsured deposit withdrawals cause even small fire sales, substantially more banks are at risk."** See [Conclusion, pages 8-9](https://papers.ssrn.com/sol3/papers.cfm?abstract_id=4387676).The goal of the project is to provide easy access to individual bank's uninsured deposit to asset ratio ("UDAR") and insured debt coverage ratio ("IDCR") without the MTM adjustment to assets (as discussed more fully below).A table of [all available reports is here](/reports/reports.qmd) and a table of [data used to create each report is available here](/data/data.qmd).If you are interested in the methodology and `R code` used to create the reports, read on below. Otherwise, you can [access all of the quarterly reports](/reports/reports.qmd).### Short Summary of How Banks Operate and How Bank Runs HappenIn banking, short-term liabilities finance long-term assets.Banks collect deposits from customers and make personal and commercial loans and buy assets like real estate securities (mortgage-backed securities etc.) and U.S. Treasuries. Like other investors and debt issuers, when rates increase these long term assets lose face value.Rate increases and a loss of face value on long-term assets is not supposed to be cause for concern as bank's match asset and liabilities based on the forecasted duration of each. When an [asset-liability mismatch](https://en.wikipedia.org/wiki/Asset%E2%80%93liability_mismatch) occurs, banks could be forced to liquidate long assets prematurely or raise capital. Rising interest rates add fuel to this fire. As the authors note, banks generally fail for two broad but interrelated reasons in a rising interest rate environment:- **Insolvency:** Bank liabilities exceed the value of it's assets. Banks don't have sufficient sources of capital or accessible equity to cover liabilities (deposits) and the bank fails.- **Panic:** Uninsured depositors and investors become concerned about potential losses and withdraw their funds, causing a panic and subsequent run on the bank.### An Brief Overview of Mark-to-Market Accounting ("MTM")What the authors of the paper adeptly point out is banks' reliance on cost basis rather than mark-to-market ("MTM") accounting for the majority of their long term assets that could likely cause the type of asset-liability mismatch and panic causing a "fire sale" over the short-term. Mark-to-Market accounting - also called Market Value Accounting or "MVA, also known as fair value accounting or marking to market, requires that an asset or liability be valued according to its market price, that is, the current price at which it could be sold." [Link](https://www.stlouisfed.org/publications/regional-economist/january-1994/making-sense-of-mark-to-market).However, banks are allowed to report the "hold to maturity" book value or face value of long term assets. "If a bank bought a bond for \$100 (book value) or if a bond promises \$100 in 10 years (hold to maturity value), basically, the bank may say it's worth \$100, even though the bank might only be able to sell the bond for \$75 if they need to stop a run." [Link](https://johnhcochrane.blogspot.com/2023/03/how-many-banks-are-in-danger.html?m=1).In other words, what a bank represents as fair value for an asset on it's balance sheet might not be what the bank could sell it for in case of a "fire sale" moment, i.e., when rates rise and a run or a potential run is suspected. As the authors point out, more than half of bank assets do not use MTM accounting and are reported at their original or contractual value. For an average bank, 42% of assets are considered loans held to maturity and 24% of assets are real estate securities and treasuries held to maturity. This means that when rates rise, and these assets become less valuable on the market as their face value drops, this "market" value is not reflected on the bank balance sheet each quarter.To remedy this, the authors of the paper used publicly available market data (ETFs etc) to mark 2021Q4 assets down to market value. They had two main conclusions from this exercise: (1) MTM treatment reveals banks assets are likely \$2 trillion lower than reported and (2) this is "an average \[decline\] of 10% across all the banks, with the bottom 5th percentile experiencing a decline of 20%." [See Introduction, page 2](https://papers.ssrn.com/sol3/papers.cfm?abstract_id=4387676).## Bank Data### Call Report Data"Every national bank, state member bank, insured state nonmember bank, and savings association is required to file a consolidated Call Report normally as of the close of business on the last calendar day of each calendar quarter, i.e., the report date." [General Instructions](https://www.fdic.gov/resources/bankers/call-reports/crinst-031-041/2022/2022-12-generalinstructions.pdf).The reporting requirements vary based upon1. The size of the bank,2. Whether the bank has foreign offices, and3. The capital standards applicable to the bank.In general, banks submit their "Consolidated Reports of Condition and Income" or "Call Reports" quarterly using [FFIEC 031 and 041 Report Forms](https://www.fdic.gov/resources/bankers/call-reports/crinst-031-041/2022/2022-12-callinst.html) or [FFIEC 051 Report Form](https://www.fdic.gov/resources/bankers/call-reports/crinst-051/2022/2022-12-051-callinst.html).Guidance on call reports, call report data and the multitude of governing bodies that oversee banks can be found via the resources below:- [FDIC Bank Call Report Information](https://www.fdic.gov/resources/bankers/call-reports/index.html) - Updated quarterly, includes call report forms, instructions and related material.- [Federal Financial Institutions Examination Council (FFIEC)](https://www.ffiec.gov/) - The FFIEC is "a formal interagency body empowered to prescribe uniform principles, standards, and report forms for the federal examination of financial institutions." FFEIC links: - [Online Information System](https://www.ffiec.gov/infosystem.htm) - List of all data, reports and forms offered by the FFEIC. - [Individual Institution Call and UBPR Reports](https://cdr.ffiec.gov/public/ManageFacsimiles.aspx) - Individual call report and [UBPR](https://cdr.ffiec.gov/public/DownloadUBPRUserGuide.aspx) data by quarter. - [Bulk Call Report and UBPR Reports - Single Period](https://cdr.ffiec.gov/public/PWS/DownloadBulkData.aspx) - Bulk data download for all banks by a quarter for call reports and UBPR. - [All FFIEC Reporting Forms](https://www.ffiec.gov/ffiec_report_forms.htm) - All forms offered by the FFIEC.- [NIC Natiional Information Center - Data Download](https://www.ffiec.gov/npw/FinancialReport/DataDownload) - XML and CSV data downloads for select banks and institutions for which the Federal Reserve has a supervisory, regulatory, or research interest.### Downloading Bulk Call Report DataAlthough several commercial options exist, bulk data download for call reports for a single quarter for all banks is available on the [FFIEC Central Data Repository's Public Data Distribution Website - Bulk Data Download](https://cdr.ffiec.gov/public/PWS/DownloadBulkData.aspx) page. The data is available in Tab Delimited or [XBRL](https://www.fasb.org/page/PageContent?pageId=/staticpages/what-is-xbrl.html&isstaticpage=true#:~:text=XBRL%20is%20used%20to%20deliver,policy%2C%20statement%2C%20and%20note.) formats.The first step in the project is to manually download, save and unzip the data from the [FFIEC Bulk Data Download](https://cdr.ffiec.gov/public/PWS/DownloadBulkData.aspx) page. The data location is referenced below in the `p.data.loc` variable. The data referenced on this page is from 2022Q4.Next, extract the data for each individual quarter and read into R.```{r}#| label: import data#| echo: true#| warning: false# data folder location for txt files from bulk data downloadp.data.loc <-"/Users/jstoetz/Dropbox/@projects/bank-fragility/data/2022Q4"# location of data filesdf.2022Q4.file.path <-list.files(p.data.loc, full.names = T)df.2022Q4.file.path.short <-list.files(p.data.loc, full.names = F)# read in all txt files into listls.2022Q4 <-lapply(df.2022Q4.file.path, function(x)(read_delim(x, col_types =cols(IDRSSD =col_double()))))# remove the last element in the list - not data we needls.2022Q4 <- ls.2022Q4[-51]# which df have character# lapply(ls.2022Q4, function(x)(typeof(x$IDRSSD))) %>% unlist()# merge all data frames in listdf.2022Q4 <- ls.2022Q4 %>%reduce(full_join, by="IDRSSD")#write_csv(df.2022Q4)```## Calculating the UDAR (Without Marking-to-Market)The authors make the point that "\[u\]nlike insured depositors, uninsured depositors stand to lose a part of their deposits if the bank fails, potentially giving them incentives to run." See [Run Incentives and Uninsured Leverage: Simple Example, page 5](https://papers.ssrn.com/sol3/papers.cfm?abstract_id=4387676).As noted above, the authors converted the non-MTM assets to MTM, concluding "the median value of banks' unrealized losses is around 9%." See [Banks' Hidden Losses: "Marking to Market", page 4](https://papers.ssrn.com/sol3/papers.cfm?abstract_id=4387676).However, I will not MTM all of the bank's assets in the calculations below and they are not represented in the [reports on the other sections of this site](/reports/reports.qmd). Imputing value to non-MTM assets is a highly variable process, and it is dependent on the current market rates and the individual instruments the author's chose as a stand-in for the value of each bank's non-MTM assets. While the author's reference several publicly traded instruments they used to impute the change in value of the non-MTM assets, it would be highly challenging to do the same. Thus, I will use the bank's assets as reported in the call report. However, since the median for reducing non-realized losses is 9%, applying this number across the board gives a very rough *estimate* of the real value of the bank's assets when determining uninsured deposit to asset ratio and insured deposit coverage ratio.Uninsured deposit to asset ratio answers the question: *would a bank have sufficient assets to cover ALL uninsured deposits assuming that the FDIC did not close the bank prior to the run ending and the bank did not have to liquidate assets via a fire sale*?As the author's observed regarding the 2022Q1 data: "while the decline in asset values \[using mark-to-market accounting on all assets\] increased the ratio of uninsured deposits to assets, virtually all banks (barring two) have enough assets to cover their uninsured deposit obligations. In other words, if the FDIC does not step in to protect the deposit insurance fund, or if the liquidation of the assets does not cause large enough fire sales, there may be no reason for uninsured depositors to run." See [Are Assets of U.S. Banks Sufficient to Cover Uninsured Deposits?, page 6-7](https://papers.ssrn.com/sol3/papers.cfm?abstract_id=4387676).Uninsured leverage is calculated by dividing the uninsured debt of the banks by the assets of the bank. See [Banking Without Deposits: Evidence From Shadow Bank Call Reports](https://www.nber.org/system/files/working_papers/w26903/w26903.pdf).Uninsured debt at the bank level includes:- uninsured deposits,- foreign deposits,- repurchase agreements ("repos"),- other borrowed money, and- subordinated debt.However, the calculations contained herein and in the [reports](/reports/reports.qmd) will only reference uninsured deposits (for a variety of reasons). Therefore, the formula for Uninsured Deposit to Asset Ratio ("UDAR") is:$$Uninsured\; Deposit\: to\: Asset\; Ratio\; = \frac{Uninsured\; Deposits\; + Foreign\; Deposits\;}{Total\; Assets}$$## Calculating the Insured Deposit Coverage Ratio ("IDCR") (Without Marking-to-Market)The authors of the paper defined the Insured Deposit Coverage Ratio ("IDCR") by using the MTM assets as$$Insured\; Deposit\; Coverage\; Ratio\; = \frac{Mark-to-market\; Assets\; - Uninsured\; Deposits\; - Insured\; Deposits}{Insured\; Deposits}$$For my purposes, IDCR can be found by using the reported bank assets rather than the MTM-adjusted assets$$Insured\; Deposit\; Coverage\; Ratio\; = \frac{Total\; Assets\; - Uninsured\; Deposits\; - Insured\; Deposits\;}{Insured\; Deposits\;}$$The authors note that a lower IDCR makes it more likely that FDIC intervention would be required. In thinking through the problem, this makes sense. The assumption is that uninsured borrowers would be first to run, leaving the remaining assets to the insured depositors (who we assume would be less likely to run in the first place since they assume their deposits are insured by the FDIC). This ratio shows what percentage of assets would be left after the uninsured depositors made a run. For example, a negative value for insured deposit coverage ratio means that the remaining assets after the bank paid all uninsured depositors is insufficient to cover the insured depositors without FDIC intervention.The authors simulated several cases of uninsured depositors running and graphed them in [Figure 4: Distribution of Insured Deposit Coverage Ratio under Different "Run" Cases](https://papers.ssrn.com/sol3/papers.cfm?abstract_id=4387676) which is shown below: (1) figures (a) and (b) show 100% of uninsured depositors running, and (2) figures (c) and (d) show 50% of uninsured depositors running.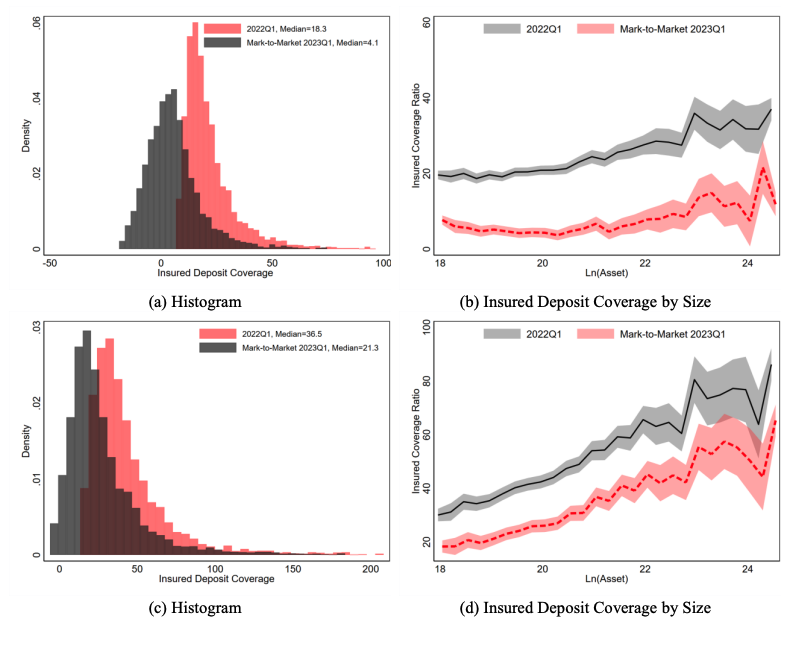## Referencing the Data in the Quarterly Call ReportsCall report data references are in the following areas on the call reports and are referenced accordingly in the R `data.frame`.- **Schedule RC-E - Deposit Liabilities - Part I. Deposits in Domestic Offices** - **RCON5590** - Preferred deposits (uninsured deposits of states and political subdivisions in the U.S. reported in item 3 above which are secured or collateralized as required under state law) (to be completed for the December report only).- **Schedule RC-O --- Other Data for Deposit Insurance Assessments** - **RCONF236** - Total deposit liabilities before exclusions (gross) as defined in Section 3(l) of the Federal Deposit Insurance Act and FDIC regulations - **RCONF237** - Total allowable exclusions, including interest accrued and unpaid on allowable exclusions (including foreign deposits). - **RCON5597** - Estimated amount of uninsured deposits in domestic offices of the bank and in insured branches in Puerto Rico and U.S. territories and possessions, including related interest accrued and unpaid. - **RCONF049** - Amount of deposit accounts (excluding retirement accounts) of \$250,000 or less. - **RCONF050** - Number of deposit accounts (excluding retirement accounts) of \$250,000 or less - **RCONF051** - Amount of deposit accounts (excluding retirement accounts) of more than \$250,000. - **RCONF052** - Number of deposit accounts (excluding retirement accounts) of more than \$250,000. - **RCONF045** - Amount of retirement deposit accounts of \$250,000 or less - **RCONF046** - Number of retirement deposit accounts of \$250,000 or less - **RCONF047** - Amount of retirement deposit accounts of more than \$250,000 - **RCONF048** - Number of retirement deposit accounts of more than \$250,000```{r}#| label: df extract and #| echo: true#| warning: false# Uninsured Deposit to Asset Ratio & Uninsured Deposit Coverage Ratio --------------------------------------------------df.uninsured.ratio <-tibble(Bank = df.2022Q4$`Financial Institution Name`,City = df.2022Q4$`Financial Institution City`,State = df.2022Q4$`Financial Institution State`,Zip = df.2022Q4$`Financial Institution Zip Code`,RCON5590 =as.numeric(df.2022Q4$RCON5590.x), # pref depositsRCON5597 =as.numeric(df.2022Q4$RCON5597), # est uninsured depositsRCONF236 =as.numeric(df.2022Q4$RCONF236), # total depositsRCONF237 =as.numeric(df.2022Q4$RCONF237), # total exclusions from depositsRCONF049 =as.numeric(df.2022Q4$RCONF049), # amount non-ret accts 250k or lessRCONF050 =as.numeric(df.2022Q4$RCONF050), # number non-ret accts 250k or lessRCONF051 =as.numeric(df.2022Q4$RCONF051), # amount non-ret accts 250k or moreRCONF052 =as.numeric(df.2022Q4$RCONF052), # number non-ret accts 250k or moreRCONF045 =as.numeric(df.2022Q4$RCONF045), # amount ret accts 250k or lessRCONF046 =as.numeric(df.2022Q4$RCONF046), # number ret accts 250k or lessRCONF047 =as.numeric(df.2022Q4$RCONF047), # amount ret accts 250k or moreRCONF048 =as.numeric(df.2022Q4$RCONF048) # number ret accts 250k or more ) %>%mutate_at(c('RCON5590', 'RCON5597'), ~replace_na(.,0)) df.uninsured.ratio.2<- df.uninsured.ratio %>%mutate(total = RCONF051 + RCONF047, #total amt uninsured deposits regular + retirementnumb = RCONF052 + RCONF048, #total number accounts uninsured deposits regular + retirementless250 = numb *-250, #total number times -250kTotal_Uninsured_Deposits = total + less250, #total uninsured minus 250k limitTotal_Insured_Deposits = RCONF236 - Total_Uninsured_Deposits, #total deposits minus total uninsured depositsTotal_Assets =as.numeric(df.2022Q4$RCON2170.x), #bank total assetsUninsured_Deposit_to_Asset_Ratio = Total_Uninsured_Deposits/Total_Assets *100, #UDARInsured_Deposit_Cov_Ratio =ifelse(Total_Insured_Deposits >0, (Total_Assets - Total_Uninsured_Deposits - Total_Insured_Deposits)/Total_Insured_Deposits, 0) #IDCR ) %>%drop_na()```### Calculating Uninsured Deposit AmountsInterestingly, only banks with greater than \$1 billion of assets are required to separately report uninsured deposits on RCON5597. See [General Instructions for FFIEC 031 and 041, page 6 and page RC-O-15](https://www.ffiec.gov/pdf/FFIEC_forms/FFIEC031_FFIEC041_202212_i.pdf) and [Form FFIEC 031, page 55](https://www.ffiec.gov/pdf/FFIEC_forms/FFIEC031_202212_f.pdf). As noted in the instructions for Form 031 and Form 041: "The bank's estimate of its uninsured deposits should be reported in accordance with the following criteria. In this regard, it is recognized that a bank may have multiple automated information systems for different types of deposits and that the capabilities of a bank's information systems to provide an estimate of its uninsured deposits will differ from bank to bank at any point in time and, within an individual institution, may improve over time." See [General Instructions for FFIEC 031 and 041, page 6 and page RC-O-15 and RC-O-16](https://www.ffiec.gov/pdf/FFIEC_forms/FFIEC031_FFIEC041_202212_i.pdf).As of 2022Q4, there are `r length(df.uninsured.ratio.2$Total_Assets)` total banks reporting of which `r length(which(df.uninsured.ratio.2$Total_Assets > 1000000))` or `r paste(round(length(which(df.uninsured.ratio.2$Total_Assets > 1000000))/length(df.uninsured.ratio.2$Total_Assets)*100,2), "%", sep="")` have greater than \$1 billion in assets.For the remainder of the banks that have less than \$1 billion in assetsdo not separately report uninsured deposits, the uninsured deposits are calculated as follows:1. add together the total *amount* of deposit accounts greater than 250k - RCONF051 (deposit amounts \> 250k) + RCONF047 (retirement deposit amounts \> 250k)2. add together the total *number* of deposit accounts greater than 250k - RCONF052 (deposit number \> 250k) + RCONF048 (retirement deposit number \> 250k)3. multiply the total number of accounts greater than 250k found in step 2 times 250,000 to return an amount that is considered FDIC insured4. subtract the amount in step 3 from step 1 giving you the excess amount that would be uninsured## Visualizing the DataBelow is a brief overview and visualization of all bank data for 2022Q4.### Bank Size and Relationship to UDAR and IDCRSince UDAR measures the uninsured deposits as a percentage of total assets, as a rule of thumb- A **lower UDAR** is relatively **safer** and means fewer uninsured deposits as a percentage of total assets,- A **higher UDAR** means uninsured deposits take up a larger fraction of a bank's total assetsIDCR or Insured Deposit Coverage Ratio measures what remains after a potential run by uninsured depositors. So, as a general rule- A **lower IDCR** means that LESS is left for insured depositors- A **higher IDCR** is relatively **safer** and shows that insured depositors (and the bank itself) would be less likely to require FDIC involvement after a potentil runIn theory, a bank with a **lower UDAR and a higher IDCR** is **safer** when compared with a bank with a **high UDAR and low IDCR**.Below is table of all banks divided by percentile "bins" based on total assets. Grouping by these asset groups, the mean UDAR and IDCR are returned. For example, the 10th percentile of banks in 2022Q4 have average total assets of \$45 million with a mean UDAR of 13 and IDCR of 3.85.- As total assets increase, so does the UDAR indicating that uninsured deposits make up a larger portion of a banks balance sheet the larger its assets grow.- The mean IDCR does not appear to have a consistent relationship with bank asset size, although banks with less than \$373 million of assets tend to have a higher IDCR than those with more assets.```{r}#| label: summary - group assets#| echo: true#| warning: falsetb.all.banks <- df.uninsured.ratio.2%>%mutate(bins =ntile(Total_Assets, 10)) %>%group_by(bins) %>%summarize("No. of Banks"=n(),"Avg Assets (thousands)"=paste("$",format(round(mean(Total_Assets, na.rm = T), 0), nsmall=0, big.mark=",", justify="centre")),"Avg Uninsured Deposits (thousands)"=paste("$",format(round(mean(Total_Uninsured_Deposits, na.rm = T), 0), nsmall=0, big.mark=",")),"Avg UDAR"=format(round(mean(Uninsured_Deposit_to_Asset_Ratio, na.rm = T),2), nsmall=0, big.mark=","),"Avg IDCR"=format(round(mean(Insured_Deposit_Cov_Ratio, na.rm = T),2), nsmall=0, big.mark=",") )kbl(tb.all.banks) %>%kable_styling(bootstrap_options =c("striped", "hover", "condensed","responsive"))```### Uninsured Deposit to Asset Ratio (UDAR)Below is a plot of the UDAR histogram with the 5th, 50th and 95th percentile of UDAR marked. Recall that UDAR measures the percentage of uninsured deposits per dollar of assets, and that a higher UDAR is relatively less preferred than a lower UDAR.```{r}# add z-scores and percentile rankdf.deposit.asset <- df.uninsured.ratio.2%>%select(Bank, City, State, Zip, Total_Assets, Uninsured_Deposit_to_Asset_Ratio) %>%mutate(zscore = (Uninsured_Deposit_to_Asset_Ratio-mean(df.uninsured.ratio.2$Uninsured_Deposit_to_Asset_Ratio, na.rm = T))/sd(df.uninsured.ratio.2$Uninsured_Deposit_to_Asset_Ratio, na.rm = T),pct =percent_rank(Uninsured_Deposit_to_Asset_Ratio) ) %>%filter(between(zscore,-5,5)) %>%arrange(State)# plot UDAR histogramplot_ly(df.deposit.asset, x=~Uninsured_Deposit_to_Asset_Ratio, name ="UDAR") %>%add_histogram() %>%add_segments(x=min(df.deposit.asset$Uninsured_Deposit_to_Asset_Ratio[which(df.deposit.asset$pct >= .05)]), #5th percentile UDAR Scorey=0, xend=min(df.deposit.asset$Uninsured_Deposit_to_Asset_Ratio[which(df.deposit.asset$pct >= .05)]), #5th percentile UDAR Scoreyend=200, line=list(color="green", width =2),name ="5th Percentile" ) %>%add_segments(x=min(df.deposit.asset$Uninsured_Deposit_to_Asset_Ratio[which(df.deposit.asset$pct >= .5)]), #50th percentile UDAR Scorey=0, xend=min(df.deposit.asset$Uninsured_Deposit_to_Asset_Ratio[which(df.deposit.asset$pct >= .5)]), #50th percentile UDAR Scoreyend=200, line=list(color="yellow", width =2),name ="50th Percentile" ) %>%add_segments(x=min(df.deposit.asset$Uninsured_Deposit_to_Asset_Ratio[which(df.deposit.asset$pct >= .95)]), #95th percentile UDAR Scorey=0, xend=min(df.deposit.asset$Uninsured_Deposit_to_Asset_Ratio[which(df.deposit.asset$pct >= .95)]), #95th percentile UDAR Scoreyend=200, line=list(color="red", width =2),name ="95th Percentile" ) %>%layout(title ="Uninsured Deposit to Asset Ratio",showlegend =TRUE,yaxis =list(title ="Number of Banks"),xaxis =list(title ="UDAR") )```### Insured Deposit Coverage RatioBelow is a histogram of the IDCR. A higher IDCR indicates that (hypothetically) insured depositors would be left with more funds when compared with a bank with a lower IDCR.```{r}df.uninsured.ratio.3<- df.uninsured.ratio.2%>%drop_na()df.deposit.coverage <- df.uninsured.ratio.3%>%select(Bank, City, State, Zip, Total_Assets, Insured_Deposit_Cov_Ratio) %>%mutate(zscore = Insured_Deposit_Cov_Ratio-mean(df.uninsured.ratio.3$Insured_Deposit_Cov_Ratio[is.finite(df.uninsured.ratio.3$Insured_Deposit_Cov_Ratio)], na.rm = T)/sd(df.uninsured.ratio.3$Insured_Deposit_Cov_Ratio[is.finite(df.uninsured.ratio.3$Insured_Deposit_Cov_Ratio)], na.rm = T) ) %>%filter(between(zscore,-5,5))plot_ly(x = df.deposit.coverage$Insured_Deposit_Cov_Ratio, type ='histogram') %>%layout(#title = "Insured Deposit Coverage Ratio",xaxis =list(title ="Insured Deposit Coverage Ratio") )```## Notes & Research- Monetary Tightening and U.S. Bank Fragility in 2023: Mark-to-Market Losses and Uninsured Depositor Runs? - [Link](https://papers.ssrn.com/sol3/papers.cfm?abstract_id=4387676) - Author: Erica Jiang Website - [Link](https://sites.google.com/view/ericajiang/home?authuser=0) - BANKING WITHOUT DEPOSITS: EVIDENCE FROM SHADOW BANK CALL REPORTS - [Link](https://www.nber.org/system/files/working_papers/w26903/w26903.pdf)- An Underappreciated Risk: The Resolution of Large Regional Banks in the United States - [Link](https://www.brookings.edu/wp-content/uploads/2019/09/Gruenberg-Remarks.pdf)- SCHEDULE RC-O -- OTHER DATA FOR DEPOSIT INSURANCE AND FICO ASSESSMENTS - [Link](https://www.fdic.gov/resources/bankers/call-reports/crinst-031-041/2011/2011-03-rc-o.pdf)- Consolidated Reports of Condition and Income for a Bank with Domestic and Foreign Offices---FFIEC 031 - [Link](https://www.ffiec.gov/pdf/FFIEC_forms/FFIEC031_202212_f.pdf). Blank PDF copy of the 031 Call Report.- General Instructions - FFIEC 031 and 041 - [Link](https://www.fdic.gov/resources/bankers/call-reports/crinst-031-041/2022/2022-12-generalinstructions.pdf).- Instructions for Preparation of Consolidated Reports of Condition and Income - FFIEC 031 and FFIEC 041 - [Link](https://www.ffiec.gov/pdf/FFIEC_forms/FFIEC031_FFIEC041_202212_i.pdf)- BULK DATA DOWNLOAD DATA DICTIONARY AND REFERENCE GUIDE - Board of Governors of the Federal Reserve System - [Link](https://www.ffiec.gov/npw/StaticData/DataDownload/NPW%20Data%20Dictionary.pdf)- List of FDIC Bank Call Analysts - [Link](https://www.fdic.gov/resources/bankers/call-reports/call-analysts.html)- Measuring Liquidity Mismatch in the Banking Sector - [Link](https://www.gsb.stanford.edu/faculty-research/working-papers/measuring-liquidity-mismatch-banking-sector)- Relationship Banking, Fragility, and the Asset-Liability Matching Problem - [Link](https://www.jstor.org/stable/4494830)
